

If Bitcoin surges past $110,000, traders betting against it could face a brutal $288 million reckoning. Data from Coinglass reveals a massive cluster of short positions primed for liquidation at this price, potentially sparking a chaotic chain reaction in the crypto market.
The $110K Powder Keg
Reaching $110,000 isn’t just a milestone—it’s a tripwire. Coinglass data shows that crossing this threshold could force the closure of $288 million in short positions across major exchanges. When shorts get liquidated, traders must buy Bitcoin to cover losses, often driving the price higher and triggering more liquidations—a phenomenon known as a short squeeze.
This isn’t a hypothetical. On February 28, 2024, when Bitcoin broke $60,000, $270 million in short positions were wiped out in hours. The ripple effect didn’t stop at Bitcoin: Solana and Avalanche, coins not even in the spotlight, spiked 12% as the buying frenzy spilled over. Low-liquidity altcoins are especially vulnerable to these sudden swings, catching unprepared traders off guard.
Why this matters to you: If you’re trading altcoins or using leverage, a Bitcoin surge could upend your positions, even if you’re not directly betting against BTC. In a liquidation cascade, it’s not about being wrong—it’s about being exposed at the wrong time.
Decoding Liquidation Heatmaps
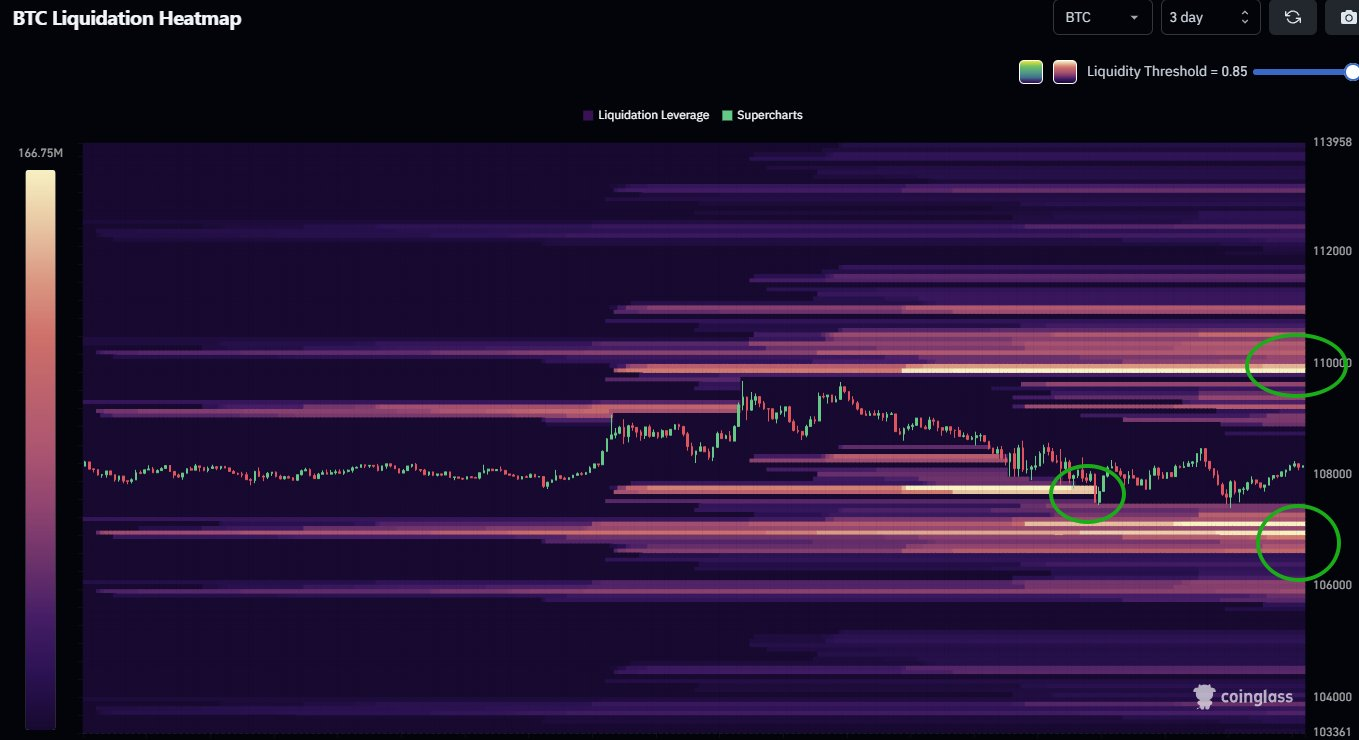
Coinglass’s liquidation charts are like a battlefield map for traders. They highlight “clusters” where leveraged positions are most vulnerable, showing the potential scale of forced buy or sell orders at specific price levels. Here’s how they work:
- Price Zones: The vertical axis tracks Bitcoin’s price, with $110,000 marked as a high-risk zone due to heavy short-position concentration.
- Color Intensity: Brighter colors (yellow to orange) signal denser clusters of leveraged bets. At $110,000, the heatmap glows, indicating a massive liquidation risk.
- Market Impact: When prices hit these zones, liquidations trigger rapid buy or sell orders, amplifying price swings.
For example, the $106,000 level also shows a dense cluster of long positions. If Bitcoin dips, these could face forced sales, pushing prices down further. These heatmaps act like a radar, revealing where the market is most likely to erupt.
Why $110K Is a Triple Threat
The $110,000 mark isn’t random—it’s a psychological and technical fortress:
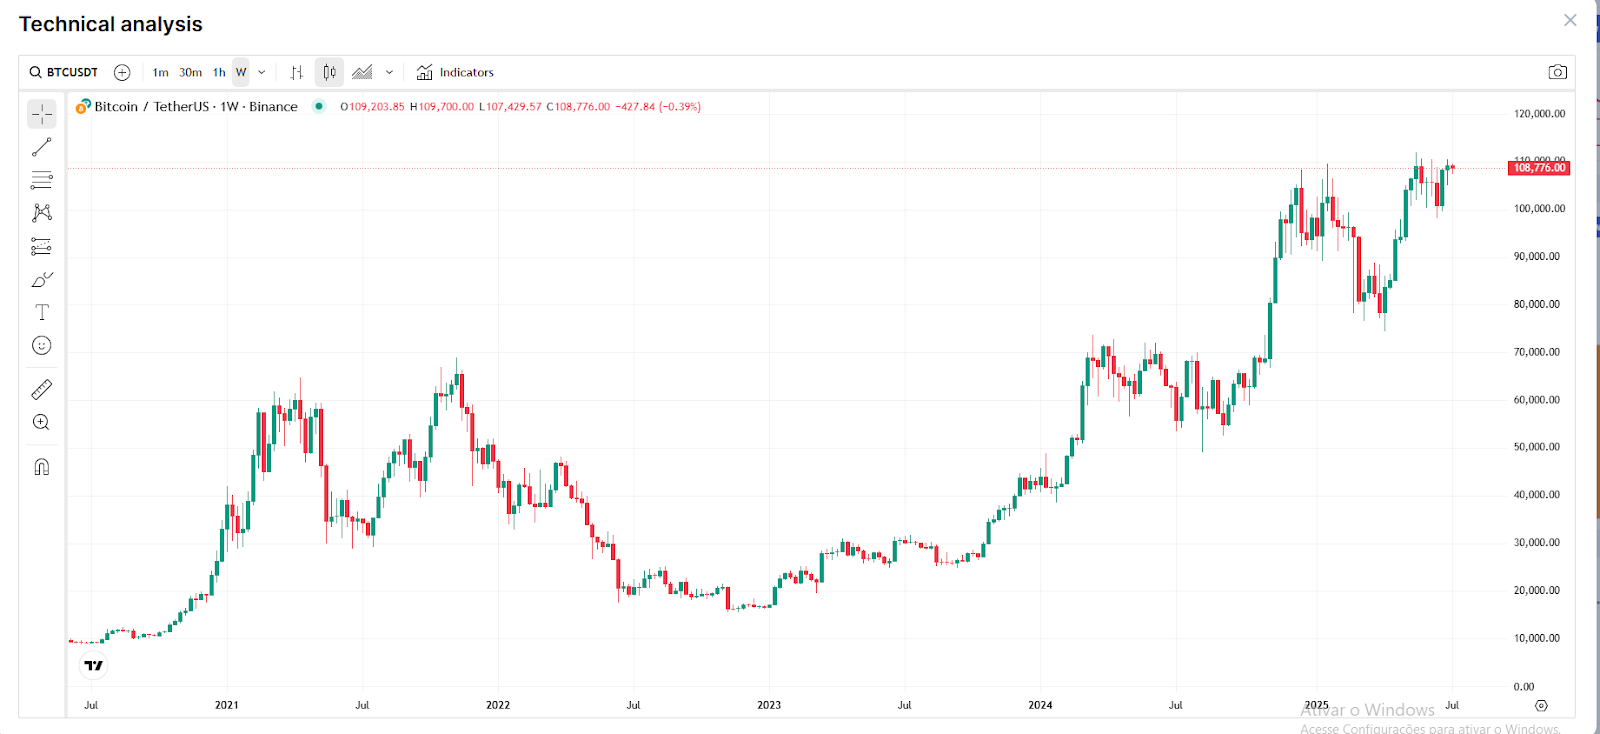
Weekly Chart: Bitcoin has tested this level twice and failed, making it a stubborn resistance.
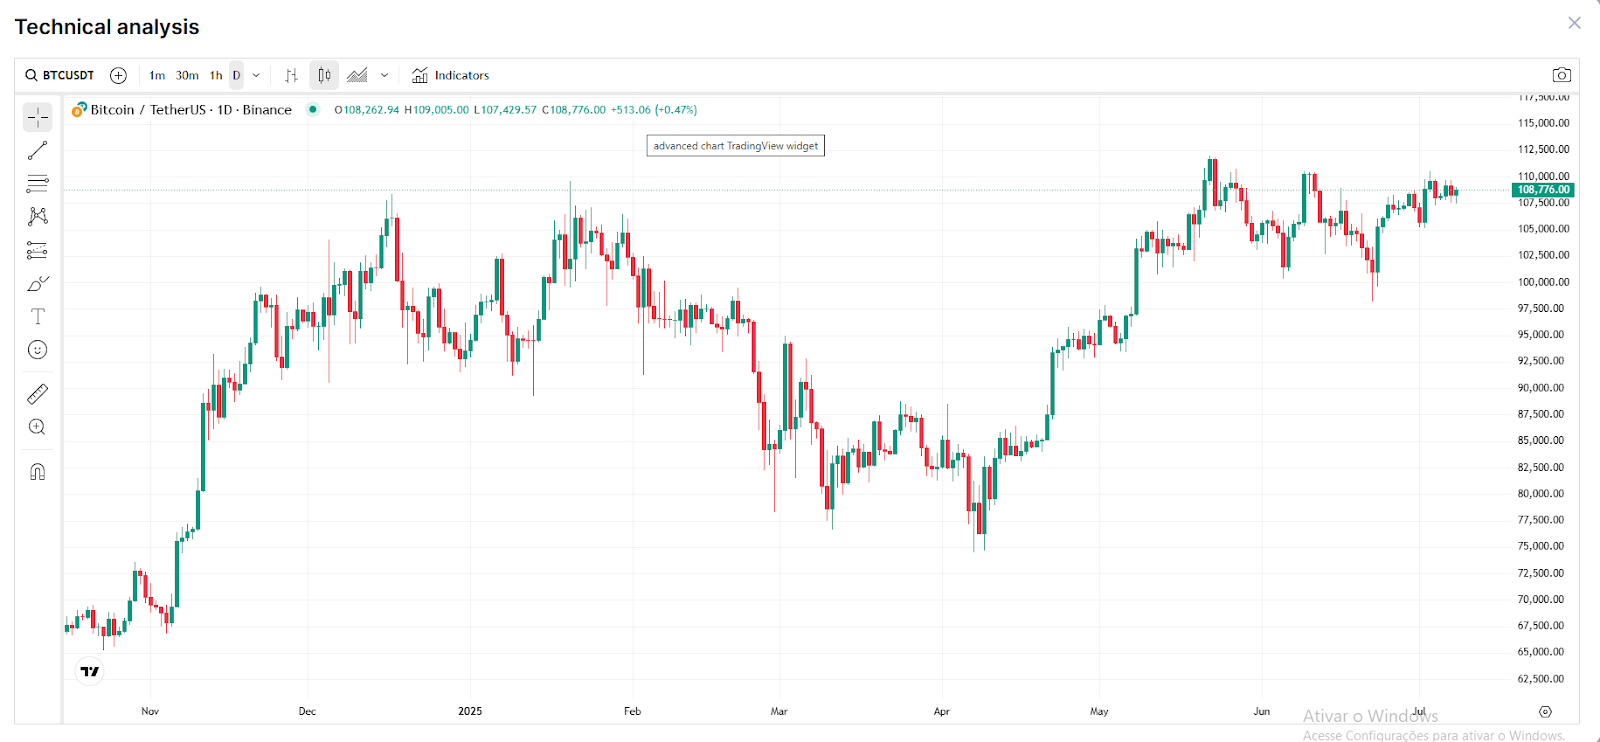
Daily Chart: Recent reversals at $110,000 confirm its role as a critical barrier.
Liquidity Magnet: The concentration of leveraged positions makes it a focal point for market movers.
This triple threat amplifies the stakes, turning $110,000 into a make-or-break level for traders.
How to Navigate the Chaos
Whether you’re bullish, bearish, or just watching, here’s how to play it smart:
– If You’re Long: Don’t assume a short squeeze guarantees profits. Squeezes are explosive but often short-lived. Time your exits carefully to avoid getting caught in a pullback.
– If You’re Short: Reduce leverage now. Liquidations don’t wait for confirmation—they hit fast. Consider hedging with options to limit downside risk.
– If You’re Hunting Opportunities: Look for altcoins that lag Bitcoin’s moves. Historically, tokens like Solana or Avalanche catch the spillover from Bitcoin’s surges, but windows are tight—act fast.
– Universal Rule: Never trade with blind conviction in a volatile market. Flexibility beats stubbornness every time.
Read More:
How to Earn $1,250 in USDT with Spell Wallet’s New X Mission
Trump’s ‘One Big Beautiful Bill’ Sparks Bitcoin Surge: What It Means for Crypto


